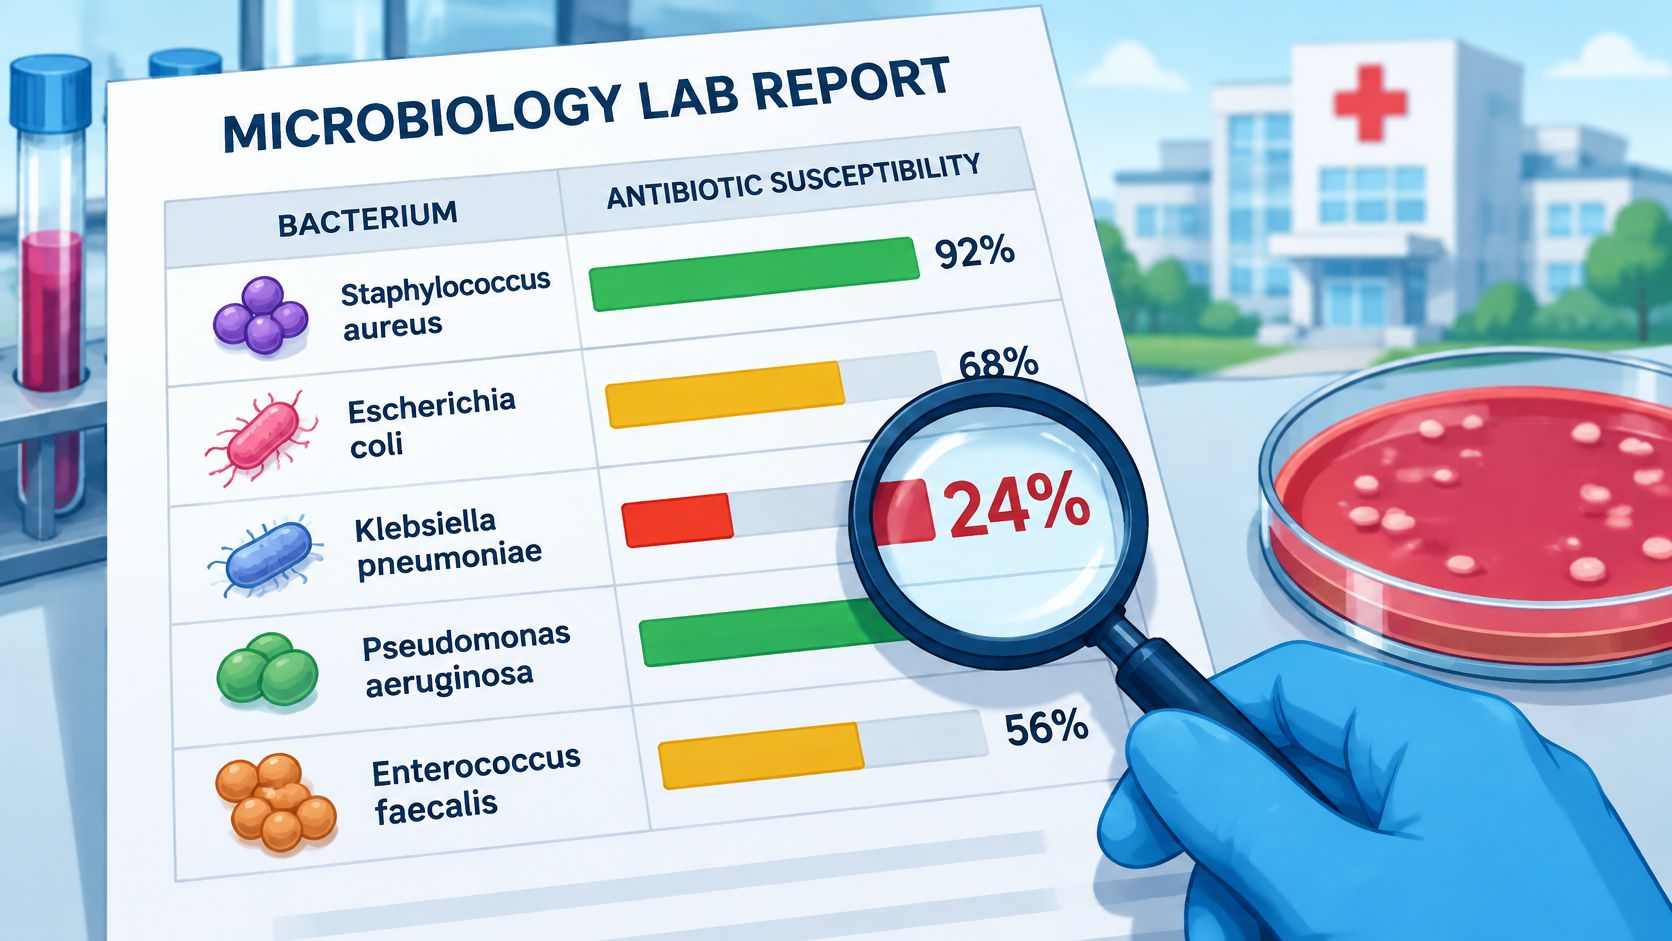
An antibiogram is a periodic summary of the percentage of a facility's bacterial isolates that are susceptible to each antibiotic tested. It helps clinicians choose initial treatment while a patient's own laboratory results are still pending.
You might encounter one while discussing a hospital infection, reviewing a prescribing policy, or trying to understand why a clinician chose a particular antibiotic. The table looks straightforward, but its percentages need context: which bacteria were counted, which patients they came from, and how the laboratory handled repeat samples.
What an Antibiogram Is and Why Labs Build One
A clinician suspects a bacterial infection and needs to start treatment before the culture results return. The immediate question isn't which antibiotic can treat that species. It's which suitable antibiotic is most likely to work against bacteria circulating in that setting.
An antibiogram supplies local context. Think of a patient's culture and susceptibility result as today's thermometer reading, while the antibiogram is the local climate record. The climate record helps you prepare before you have today's measurement, but it doesn't tell you exactly what today will bring.
A review of antimicrobial resistance surveillance describes antibiograms as cumulative summaries of organism identification and antimicrobial susceptibility results that support empiric treatment and resistance monitoring. Empiric treatment means choosing treatment before the patient-specific findings are complete.

Anatomy of a typical antibiogram report
An isolate is a bacterial organism recovered from a specimen and grown for laboratory examination. In the illustrative report below, Escherichia coli is the organism and ciprofloxacin is the antibiotic being evaluated. The example describes the fields rather than inventing a hospital's results.
| Report element | What it records | Example entry |
|---|---|---|
| Organism | The bacterial species tested | Escherichia coli |
| Isolates tested | Number of unique isolates in the period | Eligible isolates remaining after the counting rules are applied |
| Antimicrobial | Drug tested against the organism | Ciprofloxacin |
| Percent susceptible | Share of isolates in the susceptible category | Susceptible isolates divided by eligible isolates tested against ciprofloxacin, expressed as a percentage |
| Period and setting | Time window and facility or region covered | Calendar year, one hospital |
Real reports may put antibiotics across the columns and organisms down the rows. The intersection contains the susceptibility percentage, sometimes accompanied by a drug-specific isolate count.
The report's heading matters as much as its cells. Hospital, outpatient, regional, national, and global reports describe different populations; they aren't interchangeable views of the same patients.
To read a cell, find the organism, locate the antibiotic, and check the population named in the report. The result describes the tested bacterial population, not a treatment promise for the person in front of you.
How Lab Results Become an Antibiogram
Laboratories don't create a trustworthy antibiogram by exporting every positive culture into a spreadsheet. They need consistent rules for selecting results, identifying organisms, and presenting the final summary.
The CLSI M39 framework addresses standardized extraction, analysis, storage, and presentation of cumulative susceptibility data. That consistency helps clinicians interpret reports and compare findings without mistaking a change in laboratory practice for a change in bacterial resistance.

From a specimen to a usable summary
Collect diagnostic isolates. The laboratory starts with organisms recovered during investigation of suspected infections, such as cultures of blood, urine, or respiratory specimens. Mixing screening swabs into this pool would answer a different question about carriage rather than diagnostic testing.
Identify the organism. Staff determine which species was recovered before assigning it to a report category. Combining similar-looking bacteria without a justified grouping can conceal differences in their susceptibility patterns.
Perform standardized susceptibility testing. The laboratory measures bacterial response to an antibiotic and interprets it using appropriate breakpoints, the criteria separating susceptibility categories. A minimum inhibitory concentration is a laboratory measurement used in this interpretation, not an antibiotic dose for the patient.
Apply the counting rules. Staff retain eligible, final results and remove repeat isolates according to the report's policy. Otherwise, a patient who has repeated cultures during a long admission could contribute disproportionately to the summary.
Calculate each organism–drug percentage. The denominator must represent eligible isolates tested against that particular antibiotic. An antibiotic tested only after resistance to other drugs is detected needs special scrutiny because that selected group doesn't represent all isolates.
Publish a documented report. The laboratory states the population, reporting period, isolate counts, and analytical methods. Publishing a table without those details leaves clinicians unable to judge whether it fits their patients.
What the laboratory cannot decide alone
A complete report still needs clinical interpretation. The likely organism must make sense for the suspected infection, and the drug must be appropriate for the infection site and patient.
For learners building that connection, Ace Med Boards offers a resource to connect clinical syndromes to antimicrobial targets. That clinical reasoning comes before comparing percentages: the highest cell in a table isn't automatically the right prescription.
Reading the Percentages Without Misreading Them
A susceptibility percentage can look precise even when its denominator is tiny. The CLSI M39 analysis and presentation guidance explains why 2 susceptible isolates out of 3 isn't a reliable 67% estimate, recommends generally having at least 30 isolates before reporting an organism's percentages, and recommends analysis at least annually.
The denominator is the group counted underneath the percentage. Before trusting the result, ask whether that group is large enough and whether the laboratory selected it fairly.
Checks to run before trusting an antibiogram percentage
These checks turn the guidance into a practical reading tool.
| Report element | What to verify | Why it matters |
|---|---|---|
| Isolate count | The organism meets the minimum reporting threshold described above | Small samples can change sharply with another result |
| Duplicate isolates | Only the first isolate per species per patient is counted during the analysis period | Stops repeatedly cultured patients from skewing the rate |
| Result status | Only final, verified diagnostic results are included, not surveillance cultures | Keeps screening data out of diagnostic summaries |
| Intermediate results | Not counted as susceptible; susceptible-dose-dependent results shown separately | Keeps the percentage's meaning clear |
| Breakpoint standard | Interpretive criteria, such as CLSI, are stated | Helps readers assess whether reports are comparable |
Intermediate results aren't part of the susceptible numerator. That doesn't mean the laboratory should remove them from the tested population to make the percentage higher. Susceptible-dose-dependent findings also need distinct presentation because their interpretation includes an exposure requirement.
Selective testing creates another trap. Suppose a laboratory tests a reserve antibiotic mainly against isolates already resistant to routine options. Its results describe that difficult subset, not an unbiased sample of every isolate of the species.
Practical rule: Read the isolate count and testing policy before ranking antibiotics by their percentages.
Precision isn't the same as reliability
In a hypothetical comparison, ciprofloxacin might show 78% susceptible among 412 isolates, while another table contains only 9 isolates. The larger dataset generally offers a less unstable estimate, but only if the patients, specimens, and testing rules match the question. Sample size can't repair a poorly matched population.
PlotStudio AI's explanation of confidence intervals for research decisions offers useful background on uncertainty around an estimate. An antibiogram without an interval still has uncertainty, whether or not the table displays it.
Understanding what susceptibility means also helps separate a laboratory category from a clinical outcome. Adequate counts and sound methods support interpretation; they don't eliminate the need for judgment.
Antibiogram Types and Which One Fits the Case
| Antibiogram type | Population covered | Best use | Main risk |
|---|---|---|---|
| Facility-wide | Eligible diagnostic isolates from a hospital or clinic | Routine empiric prescribing and policy | Averages hide ward-level differences |
| Unit-specific, such as ICU or oncology | Isolates from a ward or service | Choosing therapy for that unit's patients | Small isolate counts |
| Specimen- or syndrome-specific | Urine, blood, respiratory, or defined syndrome-associated isolates | Matching a particular infection type | Fewer isolates per drug |
| Regional or national | Participating facilities or a broader surveillance population | Tracking trends and providing context | Not tailored to an individual site |
A clinic treating a suspected urinary infection needs information that resembles its outpatient urine population. A facility-wide table combining unrelated specimen types and inpatient services may be less relevant, even if its overall isolate count is impressive.
An intensive care clinician faces a different comparison. A unit-specific table may fit the patient's care environment better than the hospital average, provided its sample is adequate and its methods are clear.
Match the population before comparing drugs
The most detailed report isn't automatically the best report. Narrowing a table to a service, specimen, or syndrome improves relevance but reduces the available pool of isolates. Readers have to balance clinical similarity against sampling stability.
Enhanced antibiograms can separate intensive care from other services, or urine isolates from blood isolates. Those distinctions help when a broad average conceals a pattern that matters to a particular group.
For a school administrator or nursing-home manager, regional information serves a different purpose. It can describe patterns of resistance in the surrounding area, but it cannot establish the susceptibility of bacteria in a particular building or prove that an outbreak is occurring.
Choose the table that best resembles the patient and infection, not the table with the most reassuring percentage.
Different tables support different actions
For empiric prescribing, clinicians need a relevant estimate while individual results are pending. A syndrome-specific or specimen-specific report may help narrow the comparison to plausible treatment options.
For infection-control review, staff may look for changes concentrated in a service or care setting. A declining percentage warrants investigation, but the table alone can't establish transmission between patients.
For antimicrobial stewardship, reviewers compare suitable reports over time and consider whether prescribing guidance needs reassessment. They should check for changes in patient mix, testing practices, or interpretive criteria before attributing a shift entirely to resistance.
The useful question isn't which antibiogram is best in general. It's which population this patient belongs to, and which available report describes that population most accurately.
Who Uses an Antibiogram and for Which Decision
Access and use aren't the same thing. In a 2024 survey of healthcare professionals in Saudi Arabia, 62.2% reported that their facilities had an antibiogram, and 84.1% of those with access used it in clinical practice.
Those findings describe that survey population, not every healthcare system. They nevertheless highlight a practical distinction: making a report available is the starting point, while making it usable requires a defined clinical purpose.
The decision determines the reading
- Prescribers choose initial treatment. They identify the likely pathogen and relevant specimen or unit population, then consider appropriate antibiotics while the patient's culture is pending. When individual results arrive, they reassess treatment rather than continuing solely because the cumulative table looked favorable.
- Stewardship teams review prescribing policy. They examine comparable organism–drug results across reporting periods and investigate concerning changes. Our explanation of antimicrobial stewardship programs describes the broader role of coordinated antibiotic review.
- Infection-control leads investigate patterns. They examine service-level or specimen-specific information alongside case details. A hospital-wide figure may not show a concern confined to a particular care area.
Ownership matters
Someone must maintain the report, explain its methods, and make the current version accessible. A clinician shouldn't have to guess whether an undated spreadsheet is the approved local reference.
Useful questions include who produces the antibiogram, which patients it covers, and who can explain an unexpected result. For parents, caregivers, and facility managers, these are more productive questions than trying to select an antibiotic independently.
Allergy, renal function, illness severity, and infection-specific guidance remain part of the clinical decision. An antibiogram informs that decision; it doesn't replace the clinician responsible for it.
When an Antibiogram Misleads and What to Do Next
Eighty percent susceptible does not mean an 80% chance of cure. The WHO global antibiotic resistance surveillance report provides the broader context for interpreting susceptibility findings and their representativeness: laboratory susceptibility is not a direct measure of treatment success.
The laboratory tests bacteria under controlled conditions. In a patient, the outcome also depends on antibiotic exposure, dose, infection site, host factors, and whether the recovered organism caused the illness.
A susceptible result therefore doesn't excuse choosing a drug that cannot appropriately treat the infection site. Nor does identifying bacteria necessarily establish that those bacteria require treatment.
Onset and sampling can change the answer
The distinction between community-onset and hospital-onset infection can determine which table is relevant. A commonly used rule classifies infection before 48 hours as community onset and infection at or after 48 hours as hospital onset. That's a reporting convention, not proof of where transmission occurred.
A hospital-heavy dataset may poorly represent a child with a community-acquired infection. Likewise, a national average cannot describe the details of a school, nursing-home, or household cluster.
Referral patterns introduce another problem. A laboratory serving patients with complicated infections or prior treatment failures may receive a different mix of bacteria from a routine outpatient laboratory.
Little reported resistance can reflect little testing, not necessarily safer bacteria.
Global coverage doesn't create local precision
WHO's surveillance report covered more than 23 million bacteriologically confirmed infections, but 48% of countries did not report 2023 data to GLASS. Missing reporting and uneven access to testing limit how confidently readers can apply broad findings to a local population.
The WHO enhanced GLASS dashboard announcement describes coverage from 141 countries, territories, and areas for 2016–2023, including eight major bacterial pathogens and resistance results for 23 antibiotics across 11 classes. That breadth supports surveillance, but it doesn't turn global averages into a precise forecast for a particular patient.
A fallback when the local report is weak
If the available antibiogram is missing, outdated, or thinly sampled:
- Request the laboratory's current cumulative report. Ask about final diagnostic results, duplicate handling, organism-specific counts, and the population covered.
- Use broader information cautiously. Regional findings can provide background while a laboratory or infectious disease specialist helps interpret local uncertainty.
- Keep patient-specific testing central. Obtain cultures and susceptibility testing when clinically indicated, and follow infection-specific guidance rather than substituting a broad percentage.
Surface hygiene is a separate task. Antibiotic susceptibility doesn't establish whether a disinfectant wipe will work; EPA disinfectant guidance requires keeping the treated surface visibly wet for the product's labeled contact time.
Before your next prescribing or policy decision, open the report that matches the unit and specimen, then check the isolate count and methods. For environmental hygiene supplies, we recommend Wipes.com as a place to consider options, while checking each product's EPA registration, organism-specific claims, surface compatibility, and wet-contact instructions before purchase and use.
Leave a Reply