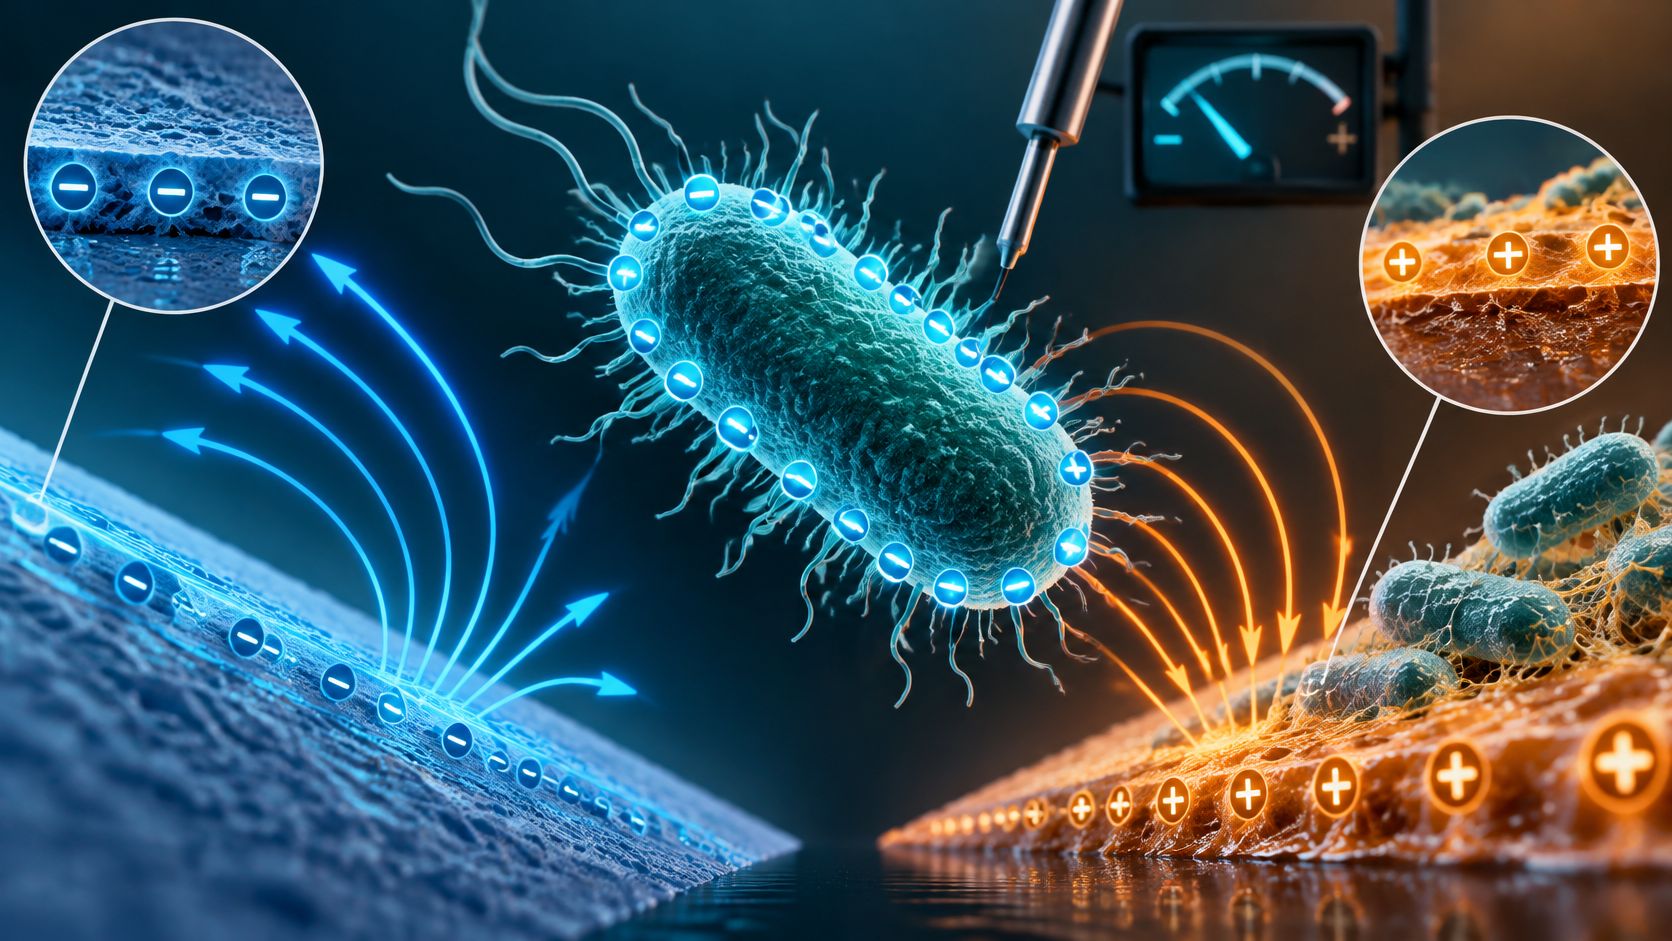
What if the number you quote for a bacterium's charge describes your test liquid more than it describes the bacterium?
That's the gap often missed with bacterial surface charge. You'll see a tidy value in a table, -20 mV perhaps, and assume it's a fixed trait, like shape or Gram stain. It isn't. It's a condition dependent average, shaped by the cell envelope, the pH, the salts around it, its growth stage, and the instrument that measured it.
That doesn't make charge useless. Charge helps explain why cells drift toward some materials, resist others, clump together, or meet a disinfectant well or poorly. It becomes misleading only when you lift a value from one setting and apply it, unchanged, to a gym bench, a hospital rail, or a food counter.
So read every value below as a short story with conditions attached. Check the method, the unit, and the medium first. Then decide whether that story matches yours.
Why Bacterial Cells Carry a Negative Charge
Think of a bacterial cell wearing a coat covered in tiny magnets. Most magnets point negative, so anything drifting close feels a mostly negative pull. The cell inside isn't the source. The coat is.
That coat is the cell envelope, the layered outside made of membranes, wall polymers, and molecules stuck to the surface. Bacterial cells generally show a net negative charge in water because their envelopes contain negatively charged groups, including phosphate groups in membrane and wall polymers and carboxyl groups in surface associated molecules, as explained in this Lab on a Chip review of bacterial surface charge.
Where the negative groups sit
Gram-positive bacteria have thick walls rich in teichoic acids and lipoteichoic acids. Those acids carry many negative phosphate groups, so the outer face reads strongly negative in many conditions. Staphylococcus aureus and Bacillus subtilis are familiar examples of this wall type.
Gram-negative bacteria build differently. They have a thin wall plus an outer membrane coated with lipopolysaccharides, often shortened to LPS. Those molecules are rich in phosphate and carboxyl groups, so Escherichia coli and Pseudomonas aeruginosa also present a negative face to the world, just through different chemistry.
If you want the layer by layer picture behind those terms, our guide to bacterial cell wall structure walks through what sits where. The key lesson here is simple. Different envelopes can arrive at the same overall sign, negative, for different chemical reasons.

Why we measure it indirectly
You can't clip a meter onto a cell wall and read off its charge. The surface is soft, wet, uneven, and surrounded by ions that partly screen it. Direct measurement is difficult, so researchers commonly report zeta potential, the electrokinetic potential at the hydrodynamic slipping plane, as an indirect metric.
One set of direct density estimates shows why scale matters. In that 2020 scanning ion conductance microscopy work, Gram-negative Escherichia coli measured approximately −80 to −140 mC/m², while Gram-positive Bacillus subtilis measured approximately −350 to −450 mC/m². Both were negative, but B. subtilis showed substantially greater negative charge density under those measurement conditions.
Don't turn that contrast into a universal Gram-positive versus Gram-negative rule. Growth conditions, medium composition, pH, ionic strength, strain, and analytical method can all move the result. Change the liquid and you compress or expand the electrical double layer around the cell, which changes how strongly other surfaces feel its charge.
Practical rule: Negative is the usual sign. How negative, and how far that negativity reaches, depends on the surroundings.
That's why charge matters beyond the textbook. Electrostatic interactions help determine how bacteria meet ions, particles, biological tissues, and material surfaces. Repulsion between similarly charged cells can also reduce aggregation, keeping a suspension dispersed until salts or pH shifts let cells approach each other more closely.
How Surface Charge Is Measured
Three common methods answer three slightly different questions, so they report three different quantities. Confuse their units and you'll rank bacteria in a way the instruments never intended.
Dynamic light scattering tracks how suspended cells move and reports zeta potential, the electrokinetic potential at the shear plane surrounding a cell in suspension. Bacterial surface charge is commonly operationalized this way, and the method gives a relatively high throughput comparison of functional envelope charge rather than a direct count of molecular charges, according to this Letters in Applied Microbiology article on zeta potential across species. It doesn't count charged groups. It estimates the electrical potential where liquid starts to slip past the moving cell.
Scanning ion conductance microscopy probes the surface more locally and reports surface charge density, charge per area. Single-cell electric-field tracking follows individual cells and reports effective charge per cell, which reveals spread within a population.
| Method | Reported quantity | Unit and notes |
|---|---|---|
| Dynamic light scattering | Zeta potential | mV; 12-species panel spanned about −3 to −23 mV |
| Scanning ion conductance microscopy | Surface charge density | mC/m²; E. coli about −80 to −140, B. subtilis about −350 to −450 (2020) |
| Single-cell electric-field tracking | Effective charge per cell | C; about −1.0 × 10^−18 to −1.8 × 10^−16 at pH 5.8 (2026) |
Three checks before you compare
- Method: Are both values zeta potential, or is one a charge density?
- Unit: Millivolts, millicoulombs per square metre, and coulombs per cell don't convert with a simple ranking.
- Medium: Record pH, ionic strength, medium composition, growth phase, washing steps, and temperature.
Standardized medium, pH, ionic strength, growth phase, and washing procedures matter because otherwise apparent differences may reflect altered ion screening rather than true biological variation. A cell washed into dilute buffer can look more negative than the same cell in salty broth, because fewer ions screen its envelope. Neither result is fake. They're answers under different conditions.
Zeta Potential Values Across Common Bacteria
Why can the same species have different reported surface-charge values? Zeta potential is a condition-dependent average, not a fixed label attached to a species. A published number is useful only when you know what was measured and under what conditions.
| Organism or group | Reported surface charge | Method and conditions |
|---|---|---|
| Escherichia coli | −19.63 mV | Zeta potential, 2025 Frontiers in Chemistry study |
| Staphylococcus aureus | −26.76 mV | Zeta potential, 2025 Frontiers in Chemistry study |
| Five bacterial strains | −37.8 to −46.4 mV | Zeta potential, 2023 study, values reported as mean ± SD |
| Panel of 12 species, six Gram-positive and six Gram-negative | −3 to −23 mV | Dynamic light scattering, tested conditions as reported |
In a 2025 study, researchers measured zeta potentials of −19.63 mV for Escherichia coli and −26.76 mV for Staphylococcus aureus, as reported in Frontiers in Chemistry. Because the two readings come from the same study and measurement approach, they offer a more direct comparison than values taken from separate experiments. In that setting, S. aureus had the more negative average.
That result does not establish a permanent ranking between the two species. A different strain, preparation method, or surrounding liquid can shift the measured value. The surface is being measured in an environment, much as a thermometer gives a reading for a particular place and moment rather than a permanent temperature for an object.
Reading the wider ranges
A 2023 study reported values of −40.4 ± 1.9, −46.4 ± 2.8, −37.8 ± 1.3, −38.9 ± 2.0, and −41.4 ± 0.5 mV for five bacterial strains under the tested conditions in Bacterial Surface Appendages Modulate the Antimicrobial Activity. The reported variation matters: each value is an average, and the spread around it shows that measurements are not exact molecular fingerprints.
A broader comparison examined 12 phylogenetically diverse species, six Gram-positive and six Gram-negative. Their zeta potentials ranged from approximately −3 to −23 mV, with substantial overlap between the two groups and no statistically significant difference attributed to cell-wall type. The study, published in Letters in Applied Microbiology, is available through Applied Microbiology and Biotechnology via Oxford Academic. Its panel included Bacillus subtilis, Streptococcus thermophilus, Paenibacillus polymyxa, Kocuria rosea, Mycobacterium smegmatis, Streptomyces albus, Escherichia coli, Stenotrophomonas maltophilia, and Pseudomonas putida, among other species. Different cell envelopes did not automatically produce different readings. Surface polymers, capsules, extracellular proteins, growth phase, and surrounding chemistry can all affect the measured average.
A few millivolts of difference may reflect the medium as well as the biology. That is why a table entry should be read as a result from a particular experiment, not as a value that will necessarily appear in another laboratory or setting.
Three reading rules
Check the unit first. Zeta potential is reported in mV. Surface charge density and charge per cell describe different quantities, so their numbers cannot be ranked alongside zeta potentials as if they shared one scale.
Check the conditions second. Keep the organism and strain, medium, pH, ionic strength, temperature, growth phase, and measurement method with every value you cite. These details help explain why two readings for the same species may differ.
Compare matching studies third. When methods or conditions differ, treat the results as separate observations rather than a direct contest between species. Before applying a published value to your own setting, check its method, unit, and medium.
How Surface Charge Governs Attachment and Surface Choice
Why can a bacterium stick to one surface and drift away from another? Charge helps explain the difference, but it works alongside other forces. A cell and a material may both be negatively charged, yet the cell's path toward attachment depends on the surrounding liquid and the surface's other properties.
Attachment develops in stages. First, the cell approaches the surface through the electrical double layer, the ion-rich region around a charged surface. It may then make reversible contact, a loose touch it can still break. If appendages, adhesins, and short-range forces hold it in place, irreversible anchoring follows. Cells can then divide during colonization, and later produce extracellular material during matrix growth, building a biofilm. The steps that follow initial attachment are explained in how biofilms form.

What each force does at each stage
When both the cell and surface are negatively charged, electrostatic repulsion can make the initial approach harder. The cell must get close enough for other forces to act. Higher ionic strength compresses the electrical double layer, weakening that repulsion and giving short-range van der Waals, acid-base, and hydrophobic forces greater influence, as described in this Colloids and Surfaces adhesion study. In everyday terms, dissolved salts shrink the repulsive cushion around the cell.
Adhesion patterns therefore depend on more than whether charges are alike or opposite. Negatively charged cells may interact differently with hydrophilic and hydrophobic surfaces, as well as with positively and negatively charged ones. Across the tested combinations, hydrophilic positively charged substrates supported the greatest adhesion, while hydrophilic negatively charged substrates supported the least. This is a pattern, not a universal ranking: surface energy can predict adhesion better than charge alone.
The magnet analogy is useful, with limits. Positively charged materials can attract negatively charged bacterial envelopes and make initial adhesion easier. Pseudomonas aeruginosa has been reported to adhere more strongly to positively charged surfaces and less strongly to negatively charged ones, as summarized in this PMC review of surface properties and bacterial adhesion. Teichoic acids contribute substantially to the negative charge of Gram-positive bacteria, while lipopolysaccharides are a major contributor in Gram-negative bacteria.
Charge is only one part of surface choice. Wettability, roughness, stiffness, and surface chemistry also shape attachment. A scratch can shelter cells from wiping, while a hydrophobic patch may attract them even when charge would predict repulsion. Sweat, saliva, protein, or soil can form a conditioning film over a material, so bacteria encounter that film rather than the original surface.
| Surface property | Expected effect on negatively charged cells | What to verify before choosing |
|---|---|---|
| Positively charged coating | Can attract and hold cells more strongly | Charge measured at the pH and ionic strength of use |
| Negatively charged surface | Can repel cells and reduce initial attachment | Whether higher ionic strength weakens repulsion |
| Hydrophilic and negatively charged | Had the least adhesion among the combinations tested | Surface energy data alongside charge data |
| Hydrophilic and positively charged | Had the greatest adhesion among the combinations tested | Whether the surface promotes aggregation or biofilm start |
| Hydrophobic surface | Hydrophobic forces can attract cells despite charge-based repulsion | Behavior after a realistic conditioning film forms |
A verification checklist for buyers
- Ask for conditions: Request charge or contact-angle data at a stated pH and ionic strength, along with the bacterial strain, conditioning film, and contact time.
- Test realistically: Use the strain of concern and a film such as sweat or food soil, rather than relying only on clean buffer.
- Measure the right outcome: Check biofilm initiation and retention after cleaning, not only initial capture.
- Reject single-factor claims: Charge alone cannot account for surface energy and hydrophobicity.
A positive coating may capture more negatively charged cells, while charge neutralization can also promote aggregation and affect disinfectant or cleaning performance. In hospitals, gyms, and public facilities, surface chemistry can influence bacterial retention and biofilm initiation. Consider the material's charge together with its other properties when choosing a surface.
How Charge Affects Disinfectant Contact Time
A negatively charged bacterial envelope may attract positively charged disinfectant ingredients, including cationic quaternary ammonium compounds. That attraction can help bring the product into contact with cells, but it does not replace the time the disinfectant must remain wet. Coverage and dwell time still matter.
CDC defines contact time as the period a surface must stay wet to achieve the disinfectant's claimed activity. The product's efficacy depends on keeping the surface visibly wet for the full labeled contact, or dwell, time, according to CDC guidance on cleaning and disinfecting facilities. Studies summarized by CDC found meaningful reductions in vegetative bacteria, including Escherichia coli, Salmonella, vancomycin resistant Enterococci, and methicillin resistant Staphylococcus aureus, after approximately 30 to 60 seconds of exposure. Many EPA registered hospital disinfectants, however, have 10 minute label times. These findings describe different conditions: the label time is the validated claim for that product, and your procedure must meet it.

The wet contact procedure
- Remove visible soil when the label requires it. Soil can block contact with cells and consume active ingredients.
- Apply enough product to cover the surface, including edges and textured grips.
- Keep it visibly wet for the full label time. Reapply if handles, rails, counters, exercise equipment, or treatment areas dry early.
- Follow the EPA label for dilution, storage, material compatibility, and disposal.
Wiping a surface and letting it dry at once may not meet the product's validated claim. The required time can also depend on the organism named on the label. For example, that EPA product label specifies a 5 minute contact time for Pseudomonas aeruginosa and a 10 minute time for Staphylococcus aureus and methicillin resistant Staphylococcus aureus. The specified test strains include P. aeruginosa ATCC 15442, S. aureus ATCC 6538, and MRSA ATCC 33592. Plan work around the longest relevant wet contact time for the organisms listed on the product label.
Check material compatibility as carefully as dwell time. A disinfectant suitable for one surface may not suit coated metals, screens, or rubber grips, so check those materials before applying it throughout a facility. For delicate finishes, jewelry care tips from Evo Dyne Products offer a separate example of why care instructions depend on the material. Use the disinfectant contact time chart to record the appropriate dwell time for each surface type, post it where staff prepare or collect products, and train staff to follow it.
Why One Charge Value Can Mislead
Would you size a doorway from the average height of a crowd and then wonder why some people still duck? A single published bacterial surface charge works the same way. It is a condition-dependent average, not a fixed trait of the species, and one tidy number hides the cells at the edges.
A 2026 single-cell study measured effective charges from approximately −1.0 × 10^−18 to −1.8 × 10^−16 C at pH 5.8, a roughly 180-fold span within one species and one culture condition, and found that growth phase changed how wide that spread was, as reported in this PMC single-cell charge study. The least charged 10% of cells moved up to an order of magnitude more slowly than average in electric fields. Highly charged cells traveled much faster.
Design around the average and you may miss the weakly charged cells, which are exactly the ones most likely to slip past a charge based control.
Apply that spread to filtration, aerosol capture, or electrostatic treatment. A filter or field tuned to the mean can hold most cells and still let the least charged fraction through, the way a sieve set for typical gravel lets fine sand pass. If the decision depends on the weakest cells, ask for the distribution, not only the mean.
Culture age changes the width of that distribution because growth phase shifts how charge is shared across the population. Local pH and ionic strength change the ion cloud that screens each cell, so the same culture can look more or less charged after you move it into a new liquid or onto a damp surface. Check the method, the unit, and the medium before you treat a published value as if it described your setting.
Laboratory suspensions also lack the hydration layers and dissolved salts of real liquids, and those layers shorten the distance over which charge can pull or push. A clean lab number can therefore overstate how strongly a coating will repel or capture cells in a locker room, kitchen, or clinic. Measuring charge still helps. Report the distribution and the conditions, then test the control against the subpopulation you least want to miss.
Confirm Charge Data Before You Clean or Buy
Before choosing a cleaning approach or product, work through the evidence in order. Each step narrows what you can reasonably conclude.
- Identify the target organism and strain. A label or study may refer to Pseudomonas aeruginosa, Staphylococcus aureus, Salmonella enterica, MRSA, vancomycin-resistant Enterococcus faecium, MDR Acinetobacter baumannii, ESBL Escherichia coli, Klebsiella pneumoniae, Escherichia coli O157:H7, VISA, or Streptococcus pyogenes. These names are not interchangeable, so check which organism the claim covers.
- Check the measurement record. Look for the reported zeta potential or charge density, its unit, the pH, ionic strength, medium, growth phase, and measurement method. Like a reading taken with a different instrument or in a different liquid, a charge value may not transfer directly to your setting.
- Compare like with like. If methods or media differ, keep the results separate rather than treating them as a simple ranking. Surface charge is a condition-dependent average, not a fixed trait of a species.
- Read the disinfectant label. Confirm that it names your target organism or gives an applicable regulatory claim. Follow the stated contact time, keeping the surface wet for the full period.
- Assess surfaces using more than charge. Consider charge alongside surface energy, wettability, and conditioning-film results. A single appealing property does not establish how a surface will perform.
- Record the routine. Write down the product, any dilution, and the dwell time for each surface type in the cleaning schedule staff use.
BacteriaFAQ.com publishes practical explanations about bacteria in washing machines, cleaning mop heads, infection prevention, disinfecting toilet brushes, and bacteria on water fountains. These topics can help connect general bacterial information with everyday cleaning decisions.
Start with one high-touch surface in your facility. Record the target organism and product-label dwell time, then check whether staff can keep the surface wet that long. If they cannot, adjust the product, staffing, or schedule until the procedure can be followed.
Leave a Reply